

Research Artifacts & Observations
NOTE: It’s time for picturesssssss! JK - you can and should add photos to any of the sections above if you think it will add to the content. That might be especially helpful under the “context” section above. I find that’s more useful for UX design portfolios vs. research, but this is a great place to add photos of the research methods and synthesis. I gathered screenshots of my work and put them all in one doc using Canva, then added the numbers and arrows.
What We Did:
Use this section to label + describe the research artifacts you worked on, and why and how you did it. This example is in the final portfolio provided in this template, but I’ll leave it here for you see as well.
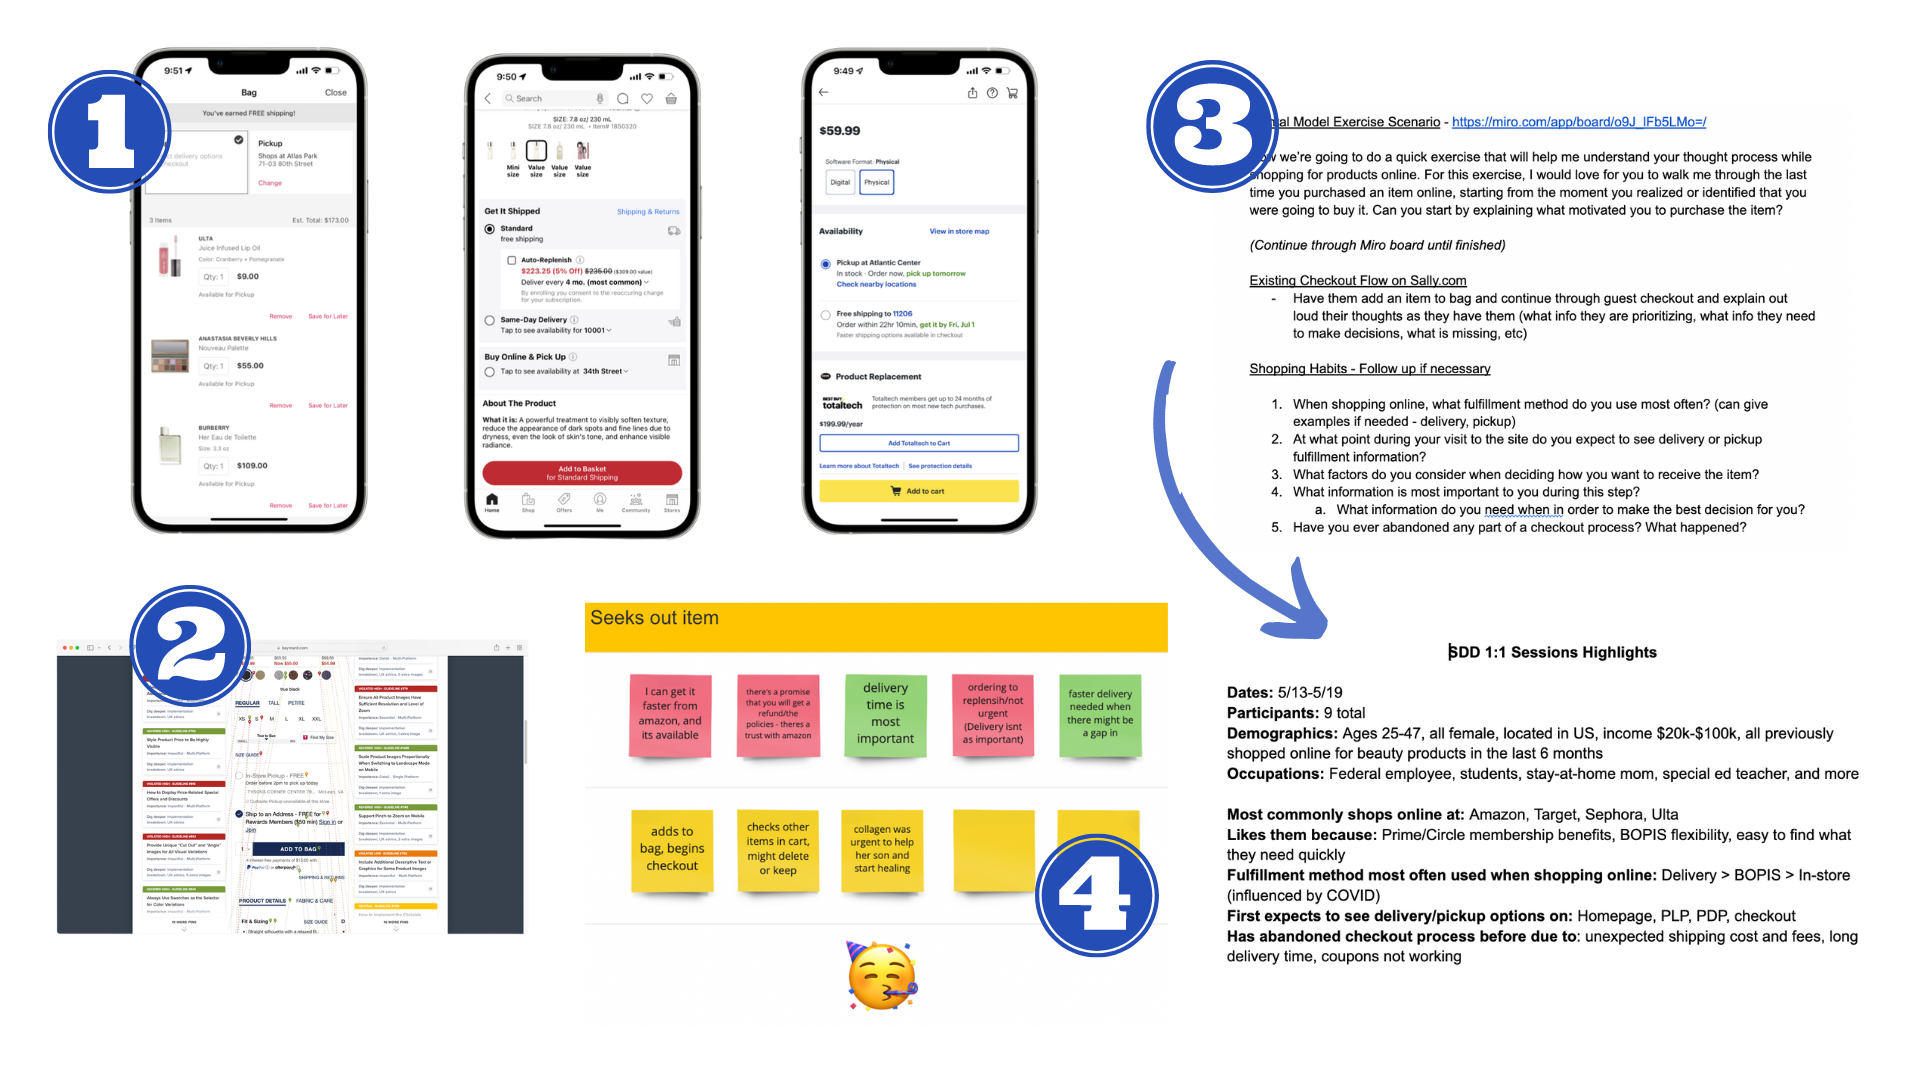
Screens taken from Ulta, Sephora, and Beauty Counter for the competitive audit
Baymard institute benchmarking
Moderator script I wrote for the 1:1 sessions the following actionable insights report
Customer journey mapping exercise where I had each participant walk me through the last time they either 1) bought something online and picked it up in the store or 2) had something delivered the same day
What We Learned:
We learned that users X and X
X (I don’t know your project - you’ll need to fill these out 😃)
X
X
(Leadership priority) This is a great place to call out if you were able to answer or uncover any of the insights leadership was hoping to learn!